

USDA NASS data · 34 states
Cash rent by state and county: 2026 farmland rental rates
In 2026 the average US cash rent for cropland was $160 per acre, down $1 from 2025, according to USDA's National Agricultural Statistics Service (NASS). Non-irrigated cropland averaged $146, irrigated cropland $244 and pasture a record $16.50 per acre. California had the highest state average for cropland at $331, followed by Hawaii ($280), Iowa ($271) and Illinois ($261). Look up your county below, or compare the 34 states Oaken covers in the table.
Source: USDA NASS state and US cash rent estimates, released July 31, 2026. Updated October 9, 2026.
State comparison
2026 cash rent by state: USDA averages and county medians
USDA’s 2026 US average cash rent is $160 per acre for cropland and $16.50 for pasture. The table puts each state’s USDA average next to its median, highest and lowest county. Select a state for every county’s rent, history and downloads.
USDA state averageOaken county view, from USDA county estimates
Swipe the table sideways to see every column.
| USDA state average | Oaken county view | USDA | Oaken county view | |||||
|---|---|---|---|---|---|---|---|---|
| United States USDA | $160Non-irrigated $146 | −$1 | — | — | — | $16.50 | — | — |
| Alabama | $78.50Non-irrigated $75 | −$2 | $46 | Limestone $139 | Choctaw $14.50 | $27 | $26 | 59 of 67 |
| Arizona | n.a.Irrigated only: $328 | n.a. | $276 | Yuma $747 | Pinal $183 | $2.80 | $3.10 | 4 of 14 |
| Arkansas | $134Non-irrigated $50 | +$7 | $30 | Mississippi $169 | Grant $13 | $23.50 | $22 | 61 of 75 |
| California | $331Non-irrigated $39 | −$15 | $34.75 | Sacramento $67.50 | Fresno $22 | $16.50 | $17.50 | 20 of 58 |
| Colorado | $83Non-irrigated $33.50 | −$4 | $30.50 | Phillips $47.50 | Las Animas $6.30 | $7.60 | $7.60 | 24 of 57 |
| Florida | $142Non-irrigated $58 | +$2 | $43.50 | Santa Rosa $107 | Madison $22 | $21.50 | $21 | 21 of 59 |
| Georgia | $156Non-irrigated $83.50 | +$3 | $58 | Pulaski $142 | Greene $16.50 | $38 | $35 | 105 of 135 |
| Idaho | $212Non-irrigated $64.50 | +$1 | $53 | Nez Perce $89 | Bannock $22.50 | $17 | $16.50 | 18 of 43 |
| Illinois | $261 | −$3 | $254 | Macon $347 | Union $86.50 | $53 | $48 | 86 of 102 |
| Indiana | $232Non-irrigated $230 | +$5 | $217 | Warren $303 | Perry $127 | $61 | $56 | 89 of 92 |
| Iowa | $271 | −$3 | $266 | Sioux $336 | Clarke $167 | $68.50 | $65.20 | 99 of 99 |
| Kansas | $77.50Non-irrigated $66.50 | +$3 | $58 | Doniphan $193 | Morton $29.50 | $24 | $24 | 102 of 105 |
| Kentucky | $170Non-irrigated $169 | +$3 | $127 | Union $259 | Whitley $17 | $39.50 | $38.50 | 86 of 110 |
| Louisiana | $112Non-irrigated $84.50 | +$1 | $55.50 | Madison $143 | St. Tammany $14 | $25 | $26.25 | 46 of 64 |
| Maryland | $136Non-irrigated $129 | +$8 | $117 | Kent $191 | Allegany $28 | $62.50 | $42 | 21 of 23 |
| Michigan | $157Non-irrigated $148 | +$6 | $98.50 | Huron $239 | Luce $17.50 | $41 | $39 | 71 of 83 |
| Minnesota | $206Non-irrigated $205 | +$6 | $189 | Martin $280 | Aitkin $18.50 | $35 | $39 | 81 of 84 |
| Mississippi | $155Non-irrigated $103 | +$6 | $66.50 | Washington $172 | Kemper $11 | $24 | $21 | 71 of 82 |
| Missouri | $158Non-irrigated $145 | +$1 | $117 | Atchison $247 | Camden $16 | $39.50 | $40 | 109 of 114 |
| Nebraska | $227Non-irrigated $168 | +$1 | $141 | Cuming $289 | Sioux $23.50 | $29.50 | $40.50 | 80 of 93 |
| New York | $89.50Non-irrigated $88.50 | +$6 | $73 | Suffolk $146 | Schoharie $38 | $30.50 | $22.25 | 47 of 62 |
| North Carolina | $105Non-irrigated $104 | −$1 | $82.50 | Hyde $182 | Polk $33 | $38 | $34.50 | 86 of 97 |
| North Dakota | $86Non-irrigated $85 | +$2 | $64.50 | Cass $163 | Mckenzie $29.50 | $23.50 | $23 | 53 of 53 |
| Ohio | $188 | +$4 | $167.50 | Shelby $256 | Belmont $26.50 | $37 | $31.50 | 76 of 88 |
| Oklahoma | $40.50Non-irrigated $36 | +$0.50 | $30.50 | Ottawa $52 | Seminole $13 | $18 | $18.50 | 74 of 77 |
| Pennsylvania | $112 | +$2 | $68 | Lancaster $289 | Wayne $15 | $48.50 | $33 | 61 of 67 |
| South Carolina | $56Non-irrigated $50 | +$0.50 | $39.50 | Horry $74.50 | Union $15 | $24.50 | $24 | 38 of 46 |
| South Dakota | $142Non-irrigated $140 | +$4 | $112 | Moody $252 | Fall River $23.50 | $31 | $47 | 63 of 66 |
| Tennessee | $121Non-irrigated $118 | +$3 | $65 | Lake $196 | Scott $20 | $30 | $28.50 | 88 of 95 |
| Texas | $50Non-irrigated $35.50 | +$1 | $27 | San Patricio $83.50 | Kendall $9.50 | $8.60 | $11 | 190 of 254 |
| Virginia | $71.50Non-irrigated $69.50 | +$1.50 | $46.50 | Accomack County $112 | Roanoke County $20 | $33.50 | $27 | 86 of 98 |
| Washington | $234Non-irrigated $74.50 | −$25 | $70.50 | Skagit $256 | Okanogan $29.50 | $8.30 | $14.50 | 25 of 37 |
| West Virginia | n.a.Non-irrigated only: $38.50 | n.a. | $30.25 | Mason $103 | Wirt $12 | $19 | $15 | 30 of 55 |
| Wisconsin | $170Non-irrigated $166 | +$4 | $136 | Grant $247 | Douglas $16 | $44.50 | $36 | 68 of 72 |
You have your county's number. Now take it to the table.
The 2026 Farmland Rent Negotiation Guide shows you how to turn county cash-rent data into a rent you can defend with your landowner.
- Adjust the county average for your farm's soils and yields
- Five calculator walkthroughs, with example outputs
- Compare cash, flex and crop-share terms side by side
- A checklist for putting the lease in writing
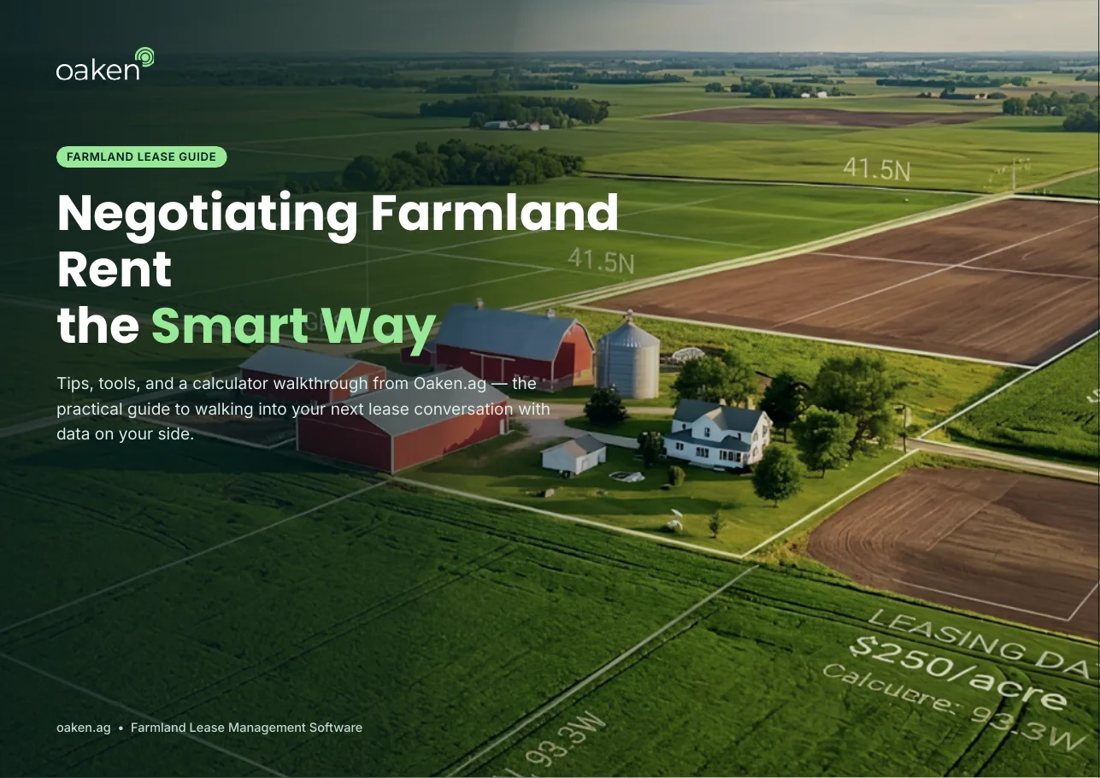
A copy is on its way to your inbox. Start with page 10 for the Cash Rent Calculator walkthrough.
Open the guideFrom data to lease
How to use county cash rent data to set a fair rent
A county average is a starting point, not the answer. Four steps take you from the benchmark to a signed lease.
- 1
Find your county benchmark
Start with the county figure above. It’s the median rent USDA NASS reports for non-irrigated cropland or pasture in that county.
Look up a county - 2
Adjust it for your farm
Soil productivity, drainage, field size and access move rent above or below the county figure. In Iowa, CSR2 is the usual yardstick.
Open the cash rent calculator - 3
Pick the lease type
Fixed cash rent, flexible cash rent with a bonus, or crop share. Compare what each would have paid on your farm.
Compare cash and flex rent - 4
Put it in writing, on time
Use a written lease and know your state’s notice deadline. Miss it and many leases roll over for another year on the same terms.
Get a state lease template
Where the numbers come from
The USDA National Agricultural Statistics Service (NASS) Cash Rents Survey. Oaken shows its county estimates for non-irrigated cropland and pasture.
Which years
2008 to 2026. NASS didn’t publish county figures for 2015 or 2018. Counties without a published figure for a year show n.a..
What it doesn’t tell you
Farm-level differences such as soil quality, drainage, tile, field size and buildings. Use a calculator to adjust for them.
FAQ
Cash rent data: frequently asked questions
What is the average cash rent per acre by state?
Among the 34 states Oaken covers, the highest 2026 county-median non-irrigated cropland rents in states with at least 20 reporting counties are Iowa ($266 per acre), Illinois ($254) and Indiana ($217). The state table on this page lists the median, the highest and lowest county and the pasture median for every state.
Where does this cash rent data come from?
From the USDA National Agricultural Statistics Service (NASS) Cash Rents Survey, which publishes county-level estimates of cash rent per acre for non-irrigated cropland, irrigated cropland and pasture. Oaken shows the non-irrigated cropland and pasture figures.
How do I find cash rent for my county?
Pick your state and county in the lookup at the top of this page to see the latest rent and the change from last year, or open your state page for every county, rent history back to 2008 and free PDF and CSV downloads.
Is the county average a fair rent for my farm?
It's a benchmark. Rent for a specific farm moves above or below the county figure with soil productivity, drainage, field size, access and local demand. Oaken's free cash rent calculator adjusts the county benchmark for these factors.
What is the difference between cropland and pasture cash rent?
Cropland rent is paid for land used to grow crops and is usually much higher per acre. Pasture rent is paid for grazing land and depends on carrying capacity and stocking rates. Oaken has separate calculators for each.
Which states does Oaken have county cash rent data for?
Alabama, Arizona, Arkansas, California, Colorado, Florida, Georgia, Idaho, Illinois, Indiana, Iowa, Kansas, Kentucky, Louisiana, Maryland, Michigan, Minnesota, Mississippi, Missouri, Nebraska, New York, North Carolina, North Dakota, Ohio, Oklahoma, Pennsylvania, South Carolina, South Dakota, Tennessee, Texas, Virginia, Washington, West Virginia and Wisconsin.
Can I download the county cash rent data?
Yes. Each state page offers a county PDF report and CSV downloads of every county. Enter your email once and every Oaken download unlocks in that browser.
For farms and farm managers
Tracking rent across dozens of leases?
County data sets the benchmark. Oaken keeps every lease’s rent, flex bonus, payment date and notice deadline in one system of record, with an alert before each one.